Thought Leadership / Commentary / Tax Loss Harvesting for Private Investments Part 3: Getting Stuck – The Embedded & Highest Cost of Private Investing
Introduction
In Part 1 of this series, we provided a single though important piece of guidance if you were planning on selling/disposing of a private investment at the end of 2021: know if the “Conservative GP Factor” was at play. Simply put, we suggested you ensure that the current value of any such private investment you were planning on exiting is (a) not being valued (too) conservatively and/or (b) not about to execute a major exit/transaction. Reminder that 2021 valuations were at relative all-time highs and portfolio company exits were more than 2x historical levels.
In Part 2 of this series, we discussed the big picture and best-in-class management practices for taxable investors with private investment portfolios: Tax-loss harvesting for private investments is a year-round process that must be fully integrated into an overall portfolio strategy and management/execution framework. We focused on integrating tax loss harvesting with the two most important tools for managing a private investment portfolio: (a) the 5-year Cash Flow Projection and (b) the 5-year Portfolio Strategy.
In this final Part 3, we bring tax loss harvesting, and all of the other strategies discussed, into focus. There is one overarching, if not embedded, factor that materially impedes and impairs the performance of every private investment portfolio and that every private investor faces: getting stuck. And therefore, every strategy and every plan for managing a private investment portfolio (including tax loss harvesting) should be focused on addressing and mitigating this one factor to best improve performance and to reduce risk.
Getting Stuck in Private Investing
When we make the statement, “getting stuck is the problem,” we typically get one of two reactions: (i) “Isn’t it loss of capital?” and (ii) “What do you mean by ‘stuck’?” First, let’s address loss of capital. Yes, loss of capital is a definite risk, and it likely occurs in every private investment portfolio. But 20 years of data shows that loss of capital only happens at a limited level, one that doesn’t materially impair total private portfolio returns. Think of a private equity fund with 20 portfolio companies. One investment may a be a total loss of capital, and there may be 1-3 others in which there is some loss of capital. The loss of 5% up to maybe slightly over 10% of a fund’s total invested capital does not drive the total fund’s final performance outcome. We see this level of capital loss across top performing funds (i.e., returning 2x of total MOIC) as well as bottom performers. Yes, capital loss is an issue, but it’s not the problem.
What Stuck Looks Like
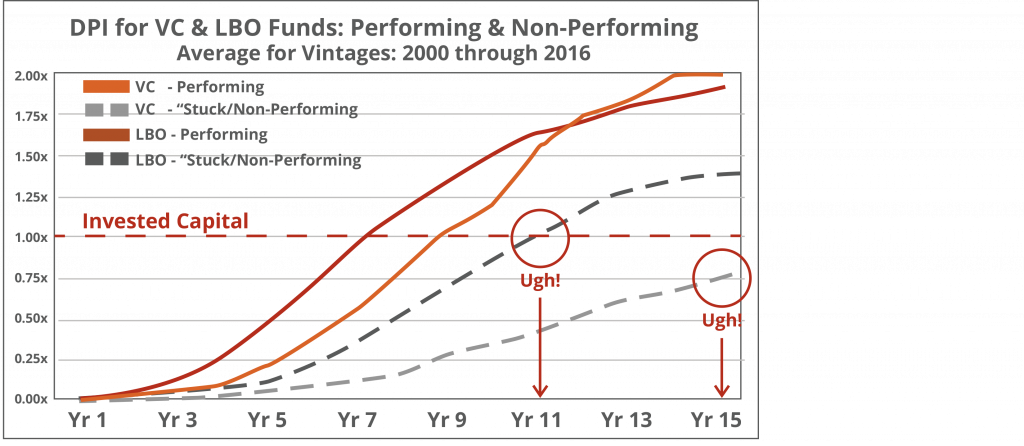
So, what does stuck look like? For a few key reasons, getting stuck is like the old boil-a-frog adage. For years, investors do not notice that anything is wrong and then they wake up one morning and their returns are “boiled.” The chart on the right shows DPI of VC and LBO fund vintages from 2000 to 2016. Using our V3 Benchmark, these funds are divided into Performing and Non-Performing groups. Performing funds return invested capital by Year 7 or 9 and go on to distribute over 1.8x by Year 15. “Stuck funds” (or Non-Performing) wait 11 to more than 15 years to return invested capital.
How Big Is The Stuck Problem?
It is incredibly important to understand just how prevalent getting stuck is in private investing. In a Fall 2021 Pitchbook Analyst Note1 about emerging managers and smaller funds vs. existing managers and larger funds, a chart shows (by Fund I through Fund IV and beyond) all historical US PE fund performance. The chart illustrates that in the US, whether a first or subsequent fund or whether a small or large fund, on average 25% of all funds achieve an IRR of 5% or less. The article also shows that for all US funds, only 10-15% achieve an IRR greater than 25%. Let that sink in for a moment: 1-out-of-every-4 US private equity funds can’t beat, or struggles to beat, the current 10-year US Treasury rate, while only 1-out-of-10 truly achieve the >25% IRR level. And this includes the 2010 through 2021 run, which many believe was a period of the PE industry’s strongest returns. It’s simply not true – and it’s especially concerning when you compare these returns to the returns of the S&P 500 and Nasdaq over the same period.
Our data indicates that the stuck problem is closer to 30-35% of all private investment funds. Again, 1-out-of-every-3. No matter the investor, no matter the investor’s access, “stuck” investments are very likely in every investor’s portfolio, and it is highly likely that getting stuck is the single greatest impairment to performance.
1Pitchbook Data Inc. article is titled “Beyond Fund I,” published 9/8/21. The chart noted is on page 4 and is titled “Performance Outcome by Fund Number.”
Getting Stuck: The “Real Cost” to Portfolio Performance
The cost of getting stuck is dramatic due to several factors:
Performance: Using multiple of invested capital (MOIC) performance. Historically, Performing VC and LBO funds distribute 2.0x and 1.9x MOIC, respectively. Conversely, Non-Performing VC and LBO funds distribute 0.8x and 1.4x MOIC, respectively.
Cost of capital/opportunity cost: Many investors think of a low IRR (i.e., 0% IRR) as the investment returning invested capital 2-3 years after the investment is made. Not much harm done. But the reality is that the opportunity cost is in fact significant. From 2000 through 2016, Non-Performing VC and LBO funds took 12 and 8 years to return just half of invested capital, respectively.
Compounding: During that time, that Non-Performing invested capital “sits idle.” If you consider a typical portfolio management reinvesting principle: when a material amount has been returned that returned capital is then reinvested (in the chart it’s when a 50% portion of invested capital is returned). Note in the chart that for Performing funds reinvestment starts in Year 6 and occurs six times by Year 11. Conversely, for Non-Performing funds the first reinvestment is not until Year 8 and only occurs three times.
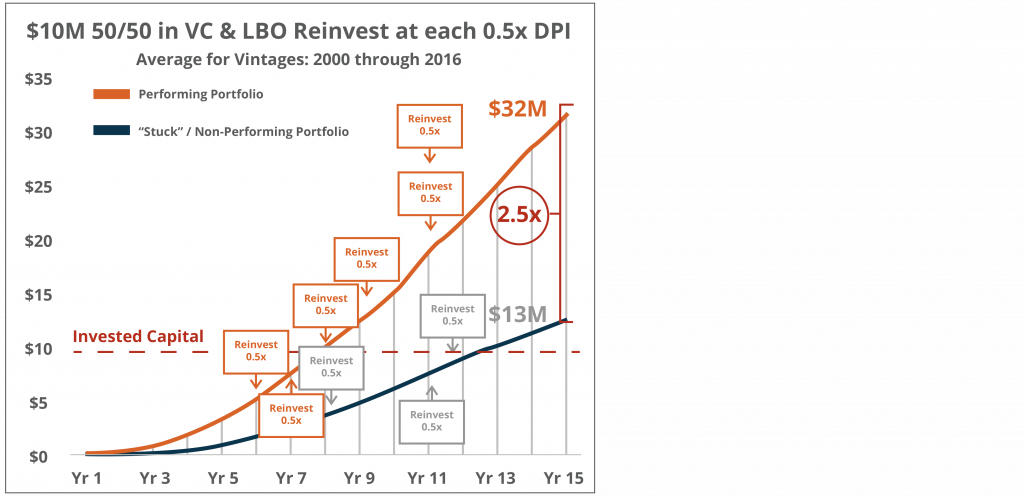
Combining these three factors and the “getting stuck damage” can be dramatic.
- Getting stuck can cost 2.5x of your invested capital over a 15-year period.
- Performing: Invest $10 million, and in 15 years receive $32 million.
- Getting Stuck: Invest $10 million, get stuck and wait 15 years to get back just $13 million.
So, What Does “Getting Stuck” Have To Do With Tax Loss Harvesting?
In Part 2 of this series, we outlined the importance of integrating your private portfolio management strategies in a year-round effort. From 5-year Cash Flow Projections, to Long-Term Allocation Planning, to Tax Loss Harvesting, best practices are to integrate all strategies and focus on them year-round. And the simple reason is that by using these strategies thoughtfully and in concert, it is possible to significantly mitigate a private portfolio’s biggest problem: getting stuck.
For example, with the goal of mitigating stuck or projected-to-get-stuck investments – and with the clear understanding of the full cost of getting stuck, tax loss harvesting strategies come into focus and importance. For example, if your on-going monitoring and due diligence uncovers a VC fund valued at cost (or 1.0x MOIC, minimal distributions to date, of a $10 million commitment fully paid-in) that is showing signs of getting stuck, and you’re able to identify a secondary buyer at a 20% discount to value and reinvest in a Performing VC fund – it’s best to consider this option. Here’s the estimated math to make the right decision (based on historical performance of Performing vs. Stuck/Non-Performing VC funds):
- Hold the Projected-To-Get-Stuck VC Fund: At the end of the next 10 years, the total distributions will equal $7.8 million, with little to no distributions expected over the subsequent/following 5 years.
- Sell the Projected-To-Get-Stuck VC Fund and Commit to a Performing VC Fund: Sell the fund for $8.0 million and then commit the $8.0 million-plus the tax loss benefit of $0.4 million [simple 20% capital loss]. At the end of 10 years, the “new” Performing VC fund will have distributed $12.0 million and would be expected to distribute an additional $7.0 million over the subsequent/following 5 years.
Hold and Get Stuck: 10-years: $7.8M received & 15-years: add’l $0.1M received
Sell & Re-Invest in a Performing VC Fund: 10-years: $12.0M received & 15-years: add’l $8.0M received
SUMMARY: Tax Loss Selling & Re-Investing: 1.5x benefit in 10-years / 2.5x benefit in 15-years
Tax loss strategies have clear financial performance targets and expectations. Obviously, no one has a crystal ball, but thoughtful monitoring and oversight coupled with continually active tax loss analysis/strategic review can give an investor a real and material advantage in driving potential long-term outperformance.
Next Step Considerations
Let’s go back to the points we made in Part 2. These are the key questions that can help an investment team make the right decisions on tax loss harvesting to improve their ability to drive material long-term value:
- Do we have a clear picture of the private portfolio construction for the years to come?
- Do we have perspective on when current reported values will be distributed? Is anything getting stuck?
- Are we always “ahead of the curve” and being thoughtful on every part of our private investment strategy execution?
- Are we seeing better investments from a risk/reward perspective (read: higher/better distributions)?
With these answers and a clear picture of what it means to get stuck (and the costs thereof), it makes sense to:
- Integrate tax loss harvesting into your year-round, long-term strategy, projections, and cash flow planning process.
- Reach out to Mirador and V3. We can provide you with tools and other help to make your portfolio more effective.